SCOPE Reports
Charts
Report by Work Package, Project, Release or by Benchmark Period. Selectively filter each Graph and customise format for your own reporting needs. Choose which Projects, Releases or Applications to report. SCOPE reports both Maintenance and Support Metrics and Project Development and Enhancement Metrics.
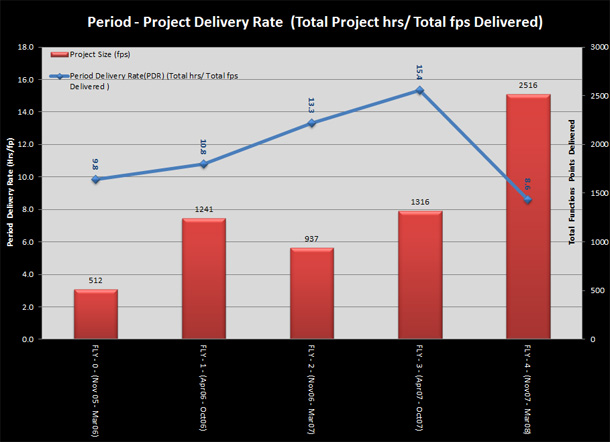
Project Delivery Rate compared to Project Size reported by Benchmarking Period
Makes you question what has been impacting your productivity.
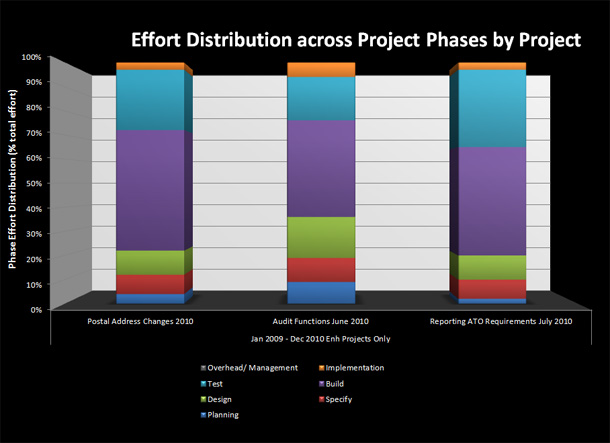
Effort Distribution by Phase
Are you spending too much time in Build and Test and not enough time in Planning and Analysis? How do you compare to Industry?
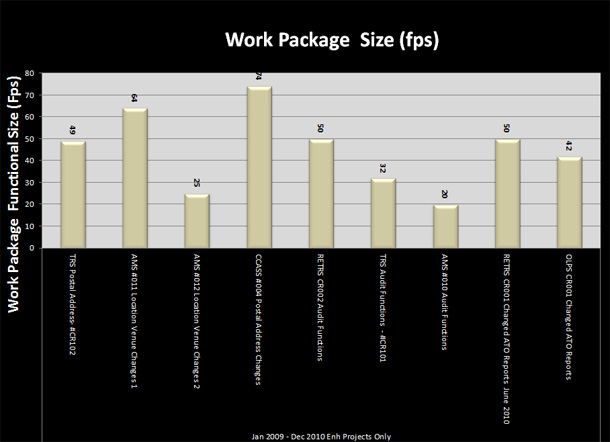
Project Work Package Size Comparison
Are you allocating the right number of resources compared to work package size?
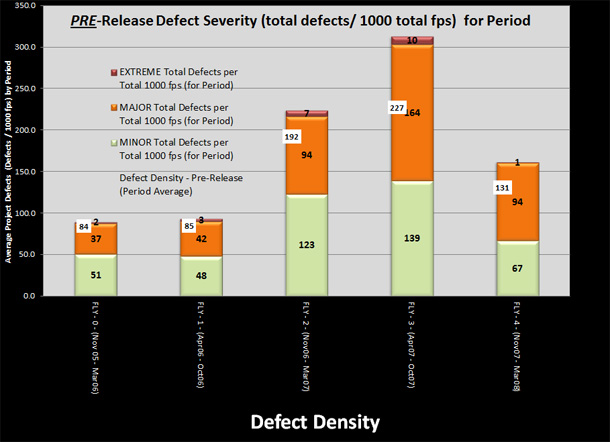
Defect Severity
What was the cause of the large increase in major defects in 2007?
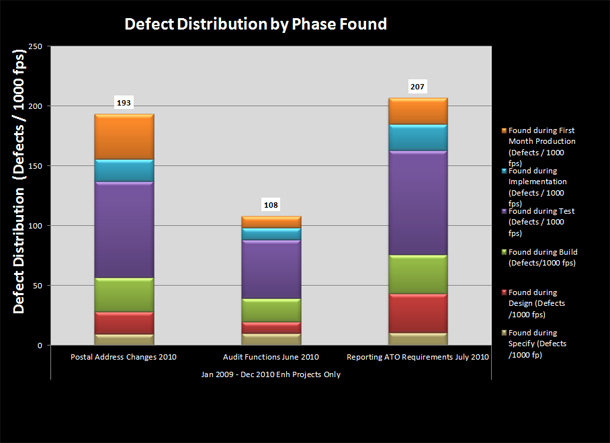
Defect Density by Phase Found
Are you finding defects early enough and which of your quality assurance processes is the most effective means of finding them.
Find out about our registered resellers for sales and support throughout - UK, Europe, North America, Asia Pacific, China, Japan, Italy and Brazil.