Earned value management (EVM) is a project management technique for measuring project performance and progress in an objective manner. EVM has the ability to combine measurements of scope, schedule, and cost in a single integrated system. Earned Value Management is notable for its ability to provide accurate forecasts of project performance problems. Early EVM research showed that the areas of planning and control are significantly impacted by its use; and similarly, using the methodology improves both scope definition as well as the analysis of overall project performance. More recent research studies have shown that the principles of EVM are positive predictors of project success.
The project can use Function Points as means of quantifying the work completed. Industry figures, (ISBSG) indicate the % of total project budgeted effort that would be consumed to get a function point to a particular project stage.E.g. in order to complete the build phase for a function 78% of the budgeted project effort is typically consumed. I.e. 78% of the function point total should have been completed.
ISBSG publishes this data and SCOPE has set up a Template Numerical attributes for Earned value using these Percentages.
Worked example:
Total budgeted effort = 1000 hours (from your project plan)
Total project size = 100 fps (measured in SCOPE)
Project delivery rate = 10 hours / fp (calculated)
Current Project Status
Total FPs completed = 57 of the planned 100 only 57% completed
Effort consumed indicates that the project is 90% complete but the FP completed figure indicates 57% complete.
57 function points should have only consumed 570 hours.
Actual effort of 900 hours would predict 90 fps completed . Slippage = (900 - 570)= 330 hours. Project is 330 hours behind schedule or 36% slippage.
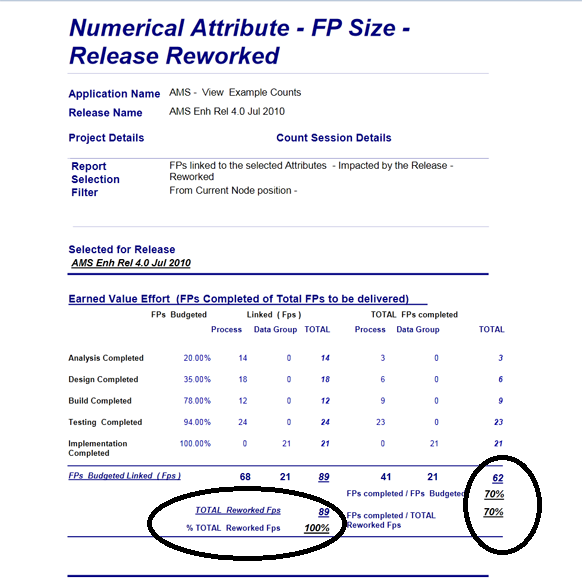
SCOPE reports the Function Points completed and the % completed of the total number of function points to be delivered. To determine the % slippage, use the SCOPE reported completed function points, project team effort consumed recorded in your time sheets, and the planned Project PDR .
SCOPE enables you to regularly report your project status using the Earned Value method. Set up the "Earned Value Effort (FPs Completed of Total FPs to be delivered) " Numerical Attribute category and follow instructions below for assigning the relevant status attributes and reporting Earned Value project status.
![]() Customising Earned Value Attributes
Customising Earned Value Attributes
NOTE: If you want to customise the Earned Value Category and names and values for the Attributes, then make your changes and SCOPE Reporting will dynamically accept all changes. To transfer your 'customised' Earned Value Numerical Category to other counts either:
 Attribute Tree on the LHS screen. Right click and select "Insert Template Category". From the Select Template drop down list select "Earned Value Effort (FPs Completed of Total FPs to be delivered) " Attributes representing project stage and the budgeted effort (Not Started, Planning, Analysis, Design, Build , Test, Implemented) and the % budgeted effort Value= 0% to 100% for that Stage. E.g. Testing Completed :Value =94%)
 flag) all processes that are impacted by this Release for all Counts.
 - then Attribute FP Size Profiles) to combine both transaction and data results.
 ![]() PRESS F5 to recalculate Numerical Attribute Results.
PRESS F5 to recalculate Numerical Attribute Results.
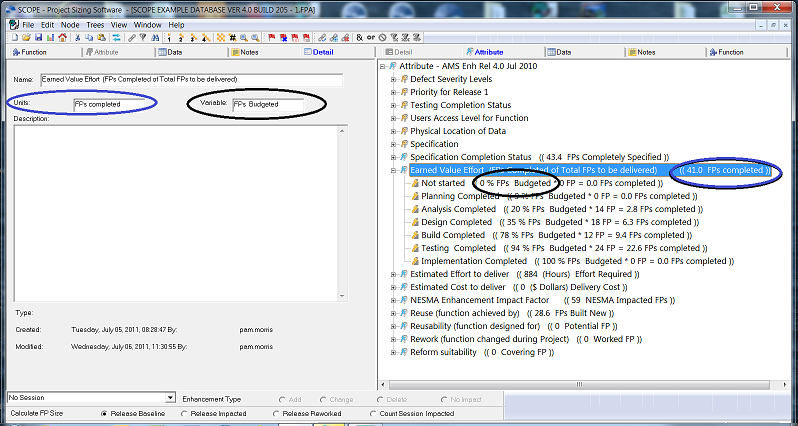
The text used in reporting the Earned Value is fully customisable in the Details Screen of the Category.