The Benchmark Tabular Reports work the same way as the other Function Point Reports in SCOPE. I.e. they have a PDF output and can be exported to Microsoft Word, Microsoft Excel and HTML.
You can select which Benchmark Data you want to report by highlighting one or more nodes on the Benchmark Metrics Tree. You can use CTRL and SHIFT to optionally select multiple nodes.
Select ![]() icon at the top of the screen. Benchmark data will be reported in a table format grouped by Benchmarking Period for the following reports:
icon at the top of the screen. Benchmark data will be reported in a table format grouped by Benchmarking Period for the following reports:
The M&S Reports - Size Usage, Maintenance and Support Effort , Defects and Environment.
All D&E Reports output all the Size, Effort, Defect, Cost, Environment Data with a summary on Project Delivery Rate (PDR Hours/FP), Cost Effectiveness ($/FP), Defect Density (defects delivered/1000 fps).
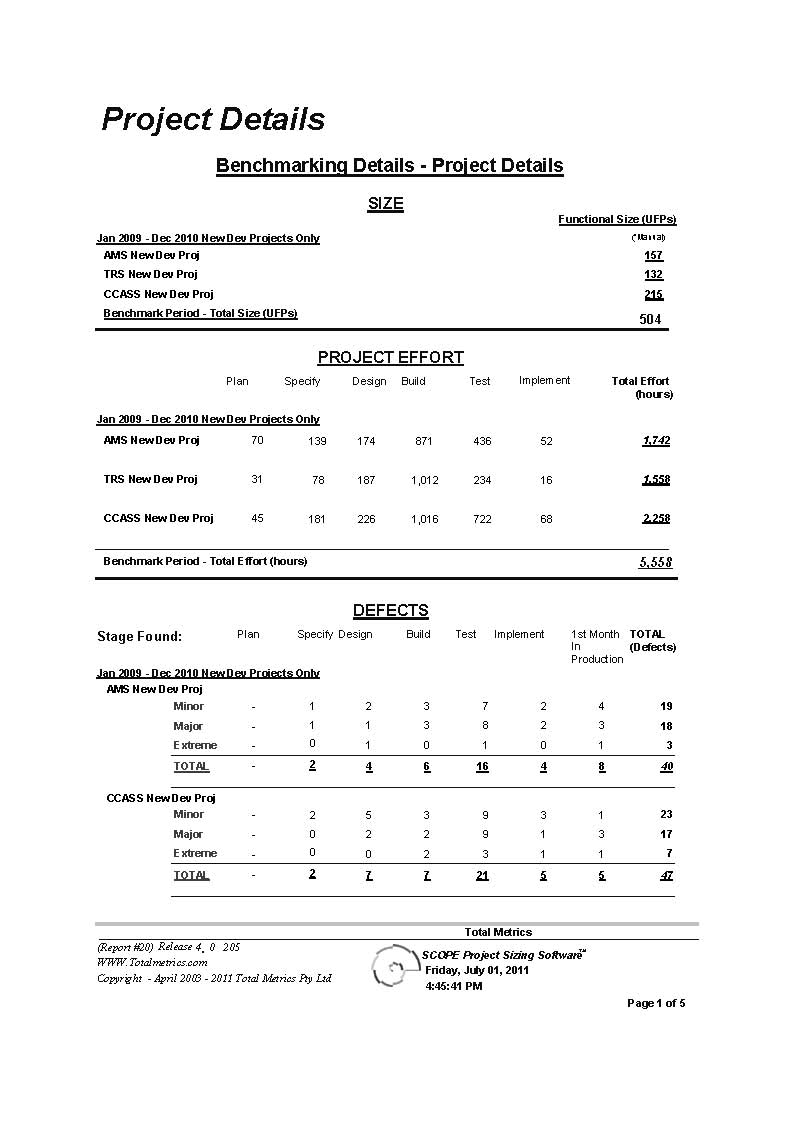
Below is an example of the Report output from the Project Details Report.